Detecting and counting bacteria with the CytoFLEX research flow cytometer: II-Characterization of a variety of gram-positive bacteria
IN THIS PAPER YOU WILL LEARN: How to set up your CytoFLEX instrument to detect and enumerate bacteria
Principle of the Technique
Background
Microbial detection and counting have application in multiple contexts, such as environmental and process monitoring. Flow cytometry offers the potential to identify and count many different species of bacteria in diverse media. With appropriate staining to permit resolution from background, it is possible to count even very low frequencies of bacterial load quite rapidly. Predicate methods can be fast but less accurate (e.g. nephelometry) or very slow by comparison (CFU—colony forming unit—count determination by culture typically takes 48 hours) and may require serial dilutions to encompass a wide range of potential concentrations, compared with a minute or less by FCM (flow cytometry).
Research Applications: Introduction
|
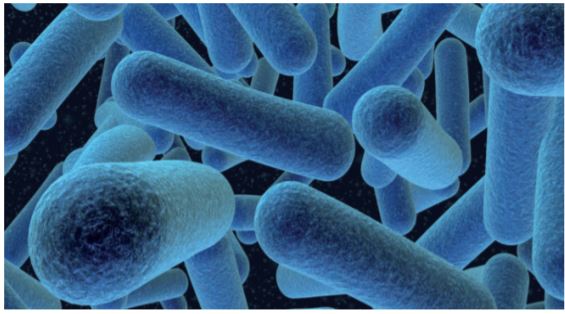
This is the second of three associated notes, looking at a range of different bacterial species, both coccus and bacillus forms, and examining the capabilities of the CytoFLEX for their detection and enumeration. In this note, eight representative gram-stain positive species are compared with negative control samples. The first note in the series examines a range of gram-negative bacteria and the third note demonstrates count linearity over a wide range (6-log decades) of concentrations and flow rates. Listeria http://www.ambwallpapers.com/listeria-hd-wallpapers/ |
 |
|
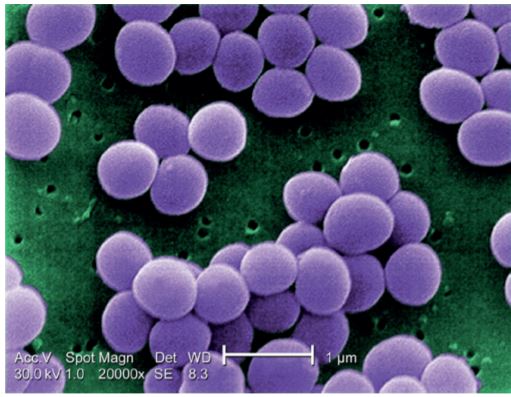
Gram positive bacteria include many genera that are of economic importance: usually due to their pathogenicity as food contaminants (e.g., Listeria monocytogenes) or association with disease and infection (e.g., Staphylococcus spp. and Streptococcus spp.). 1. https://commons.wikimedia.org/wiki/File%3AStaphylococcus_aureus_VISA_2.jpg |
 |
Protocol
Standard Procedure
Cultures of each species of bacterium were assayed by nephelometry (densitometry) and resuspended in PBS to 0.5 McFarland units, or nominally 150 x 106 mL-1, identified as [1x]. Aliquots were further diluted with PBS to 1/10x or 1/100x concentration, corresponding to nominal 15 or 1.5 x 10³ µL-1, respectively, before analysis on the CytoFLEX.
Samples were run unstained or labelled with the nucleic-acid staining SYTO vital dye mixture from the SYTO BC kit [Thermo Fischer Scientific]. Manufacturer’s instructions call for use of this dye at 1 µL stock (in DMSO) per 1 mL of sample, but this was found to cause significant secondary staining in practice. Very satisfactory staining was achieved by creating a secondary stock solution at this same rate (1 µL primary stock in 1 mL of PBS) which was used at a rate of 5 µL per 500 µL sample aliquot, or 1 % of recommended concentration.
Instrument Configuration
| Instrument Configuration | VSSC | Plate or Tube Format |
| Any: B4-R0-V0 and up | No | Either |
Any standard CytoFLEX configuration can be used for this assay, as it only requires the blue laser for forward and sidescatter (FSC & SSC) and green SYTO fluorescence measured in the normal FITC channel.
Acquisition Settings
Since bacteria are smaller than most eukaryotic cells typically analyzed by FCM it is necessary to modify the gain settings for FSC (forward scatter) and SSC (side scatter) signals from the CytoFLEX default. Fluorescence gain is within normal range.
Fixed duration acquisitions are preferred over fixed count in order to assay a constant volume, and make any necessary background count subtraction corrections more straightforward.
Initial characterizations were performed at 10 µL per minute (Low) flow rate for 30 seconds, so a fixed volume of 5 µL per sample.
Results
The following series of plots all show an ungated log-log scatter density plot, with a generic ‘bacterial’ gate (magenta). Except for the controls, this plot displays an unstained aliquot of bacteria.
The second plot is another dual log scatter plot, but this time a dot-plot, which allows color-gating to be shown. A second region is defined here as ‘live’ (blue) based upon the SYTO-positive population.
The last plot is a single parameter histogram overlay of green (SYTO) fluorescence, comparing unlabeled and labeled aliquots of the bacterium in question, with the ‘SYTO+’ region used to back-gate the second plot.
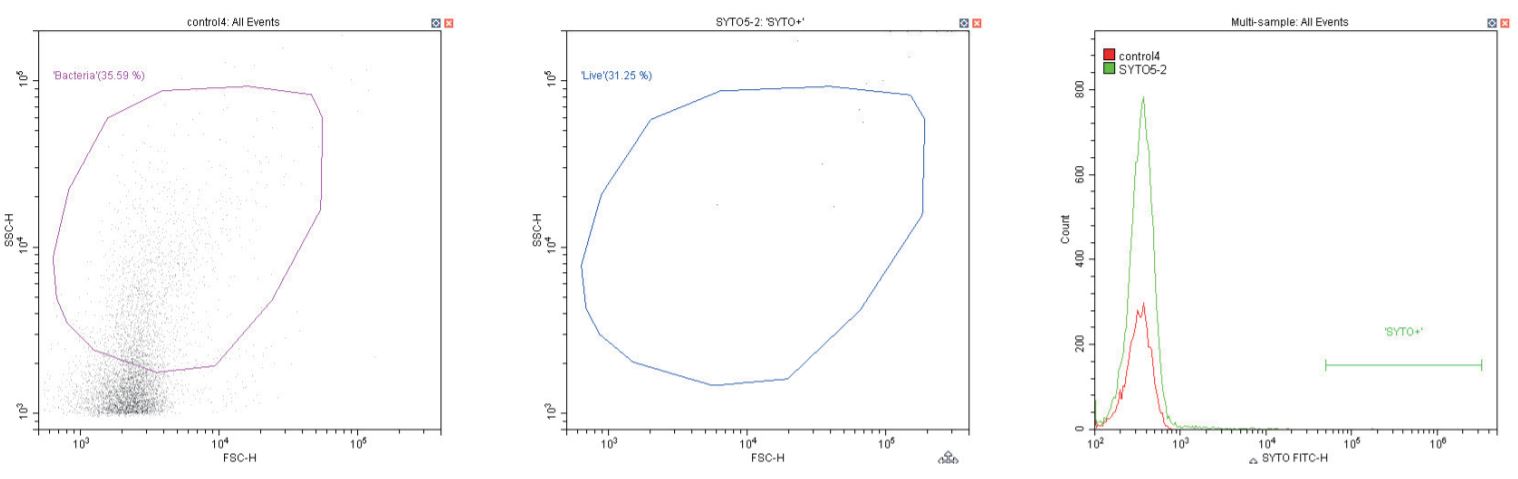
Negative control (left) Sheath only; Negative control (center & right) sheath and SYTO dye at recommended 1 µL/1 mL concentration
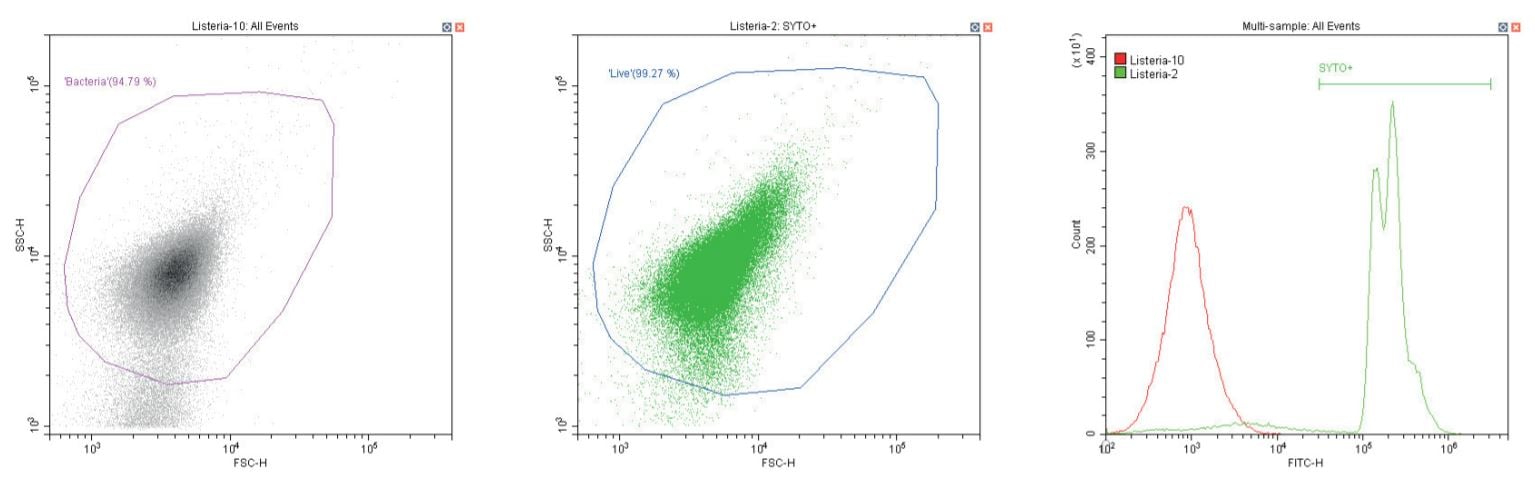
Gram-positive bacillus Listeria monocytogenes. Unstained (left) and stained (center)
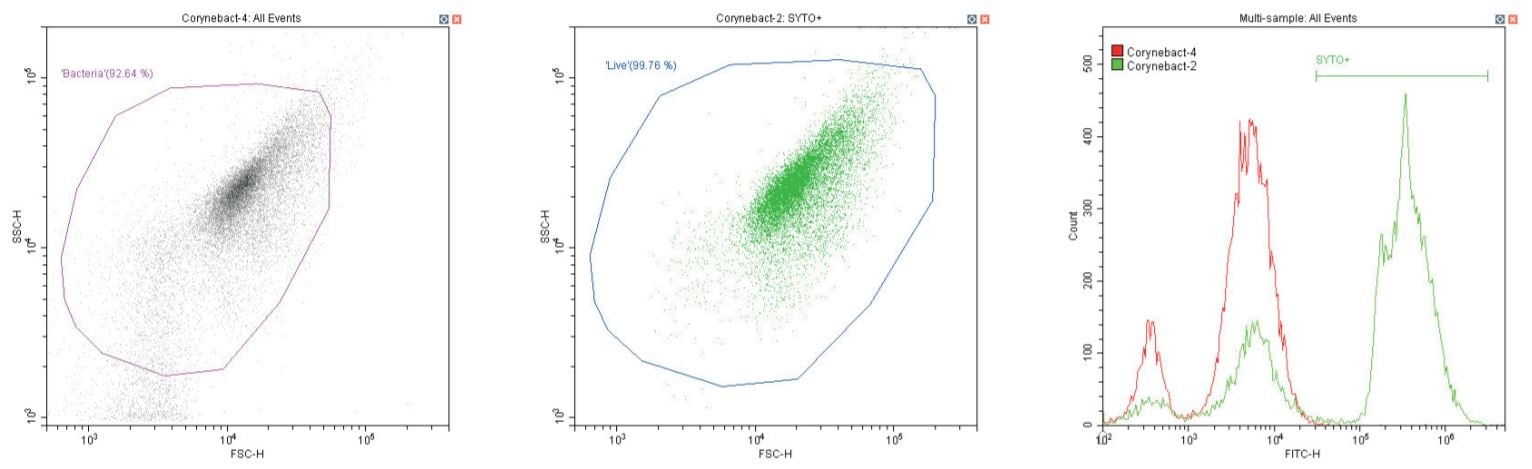
Gram-positive bacillus Corynebacterium spp. Unstained (left) and stained (center)
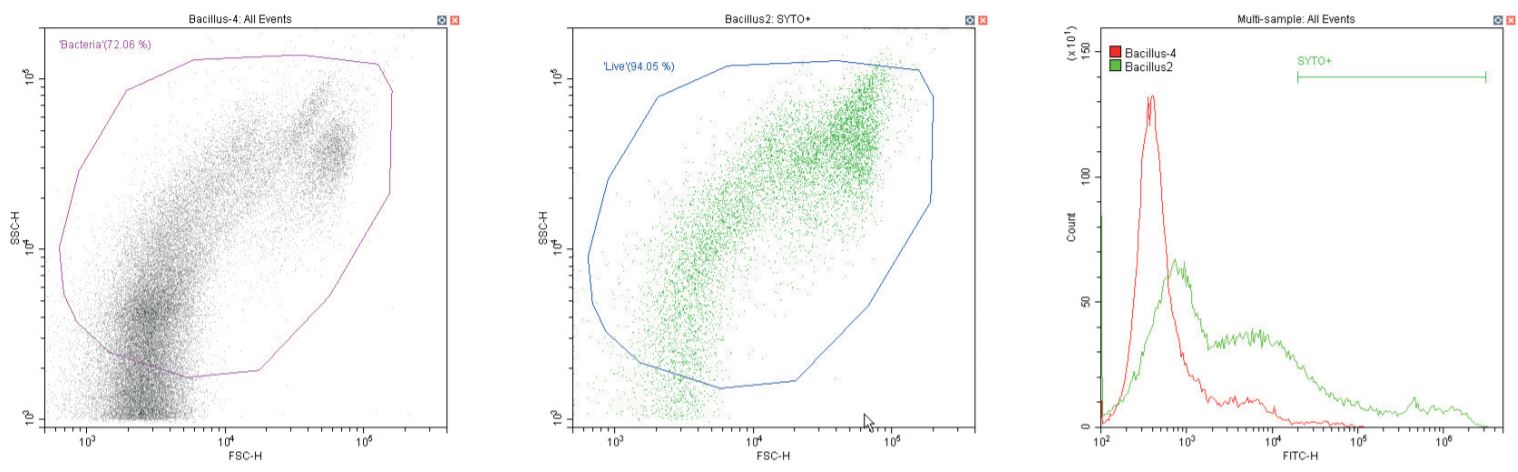
Gram-positive Bacillus spp. Unstained (left) and stained (center)
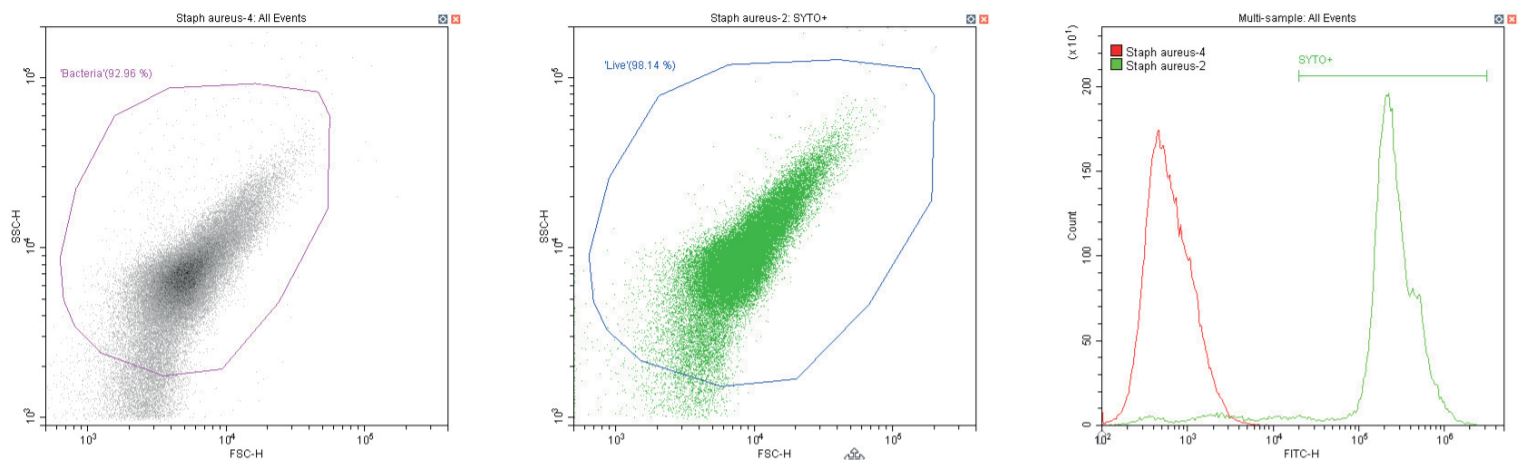
Gram-positive coccus Staphylococcus aureus. Unstained (left) and stained (center)
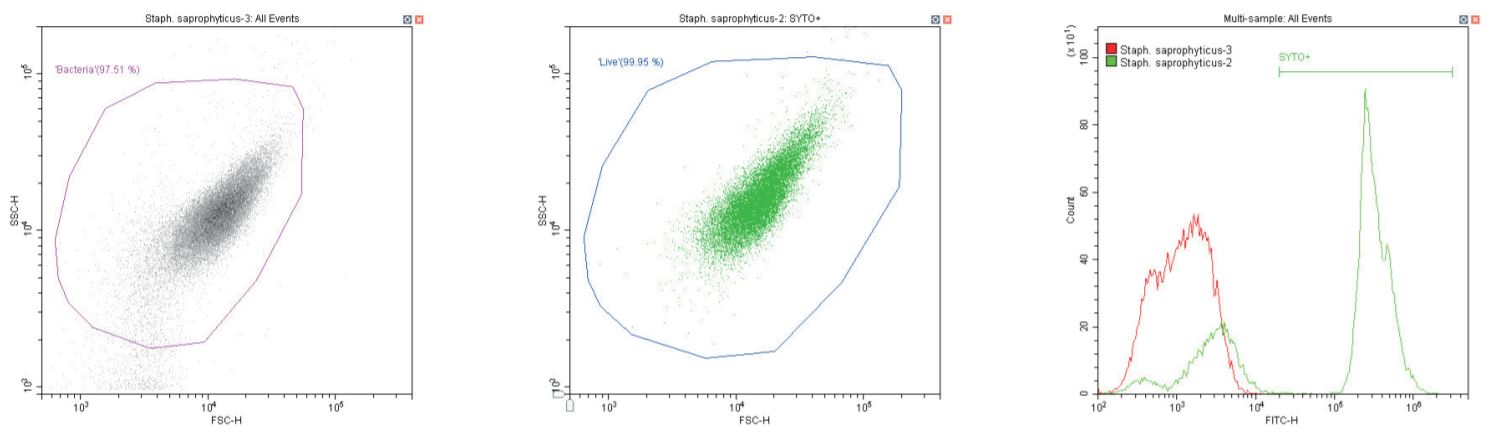
Gram-positive coccus Staphylococcus saprophyticus. Unstained (left) and stained (center)
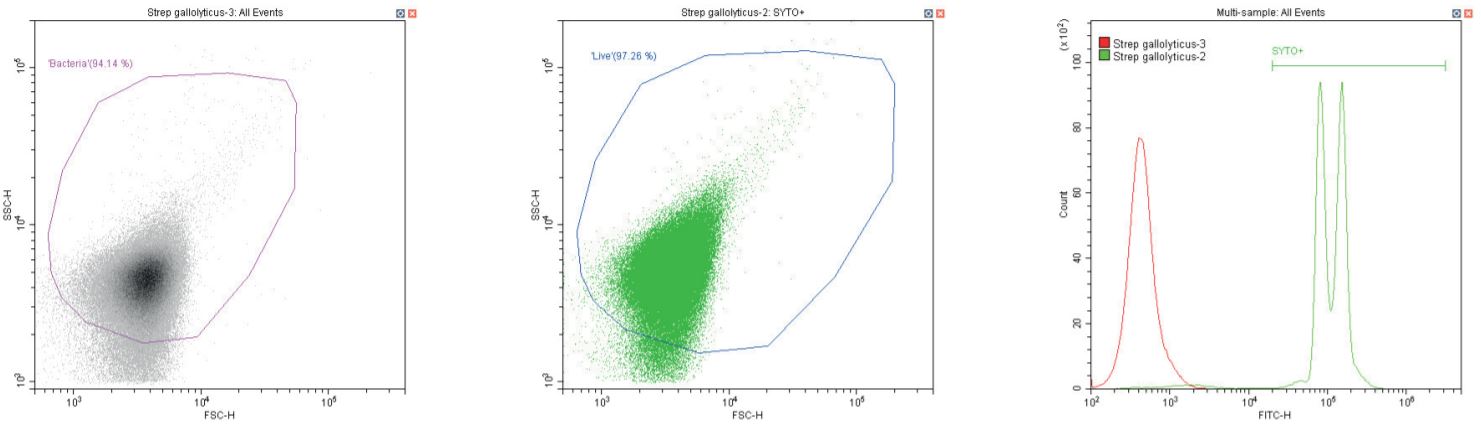
Gram-positive coccus Streptococcus gallolyticus. Unstained (left) and stained (center)
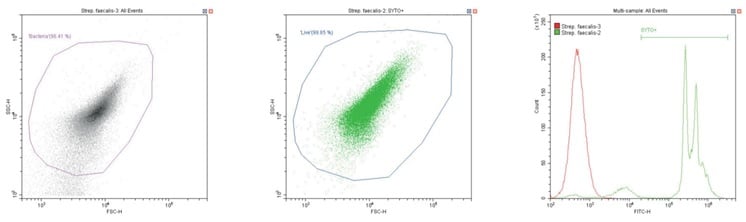
Gram-positive coccus Streptococcus faecalis. Unstained (left) and stained (center)
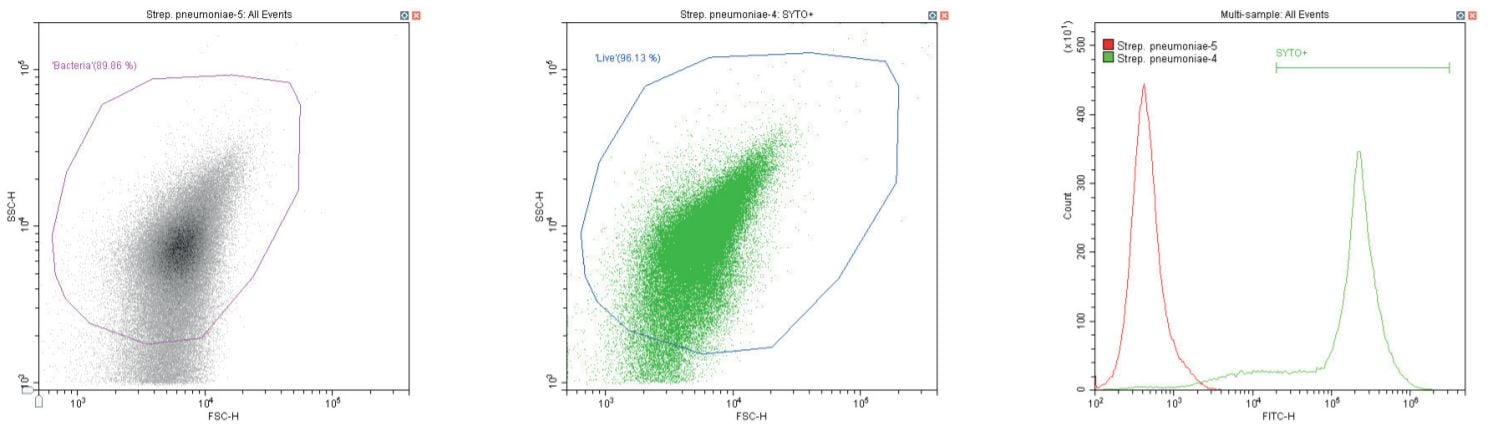
Gram-positive coccus Streptococcus pneumoniae. Unstained (left) and stained (center)
Notes
Even working at a lower SYTO dye concentration (as low as 1 % of recommended), care is still required if a stained sample is followed by an unstained (negative control) sample. This can be monitored using a plot of SYTO fluorescence vs time during sample acquisition. The presumptive mechanism is dye adsorption onto sample tubing and its subsequent release. Running a small volume of dilute (10 %) sodium hypochlorite as a sample and then rinsing with DI controls this issue effectively.
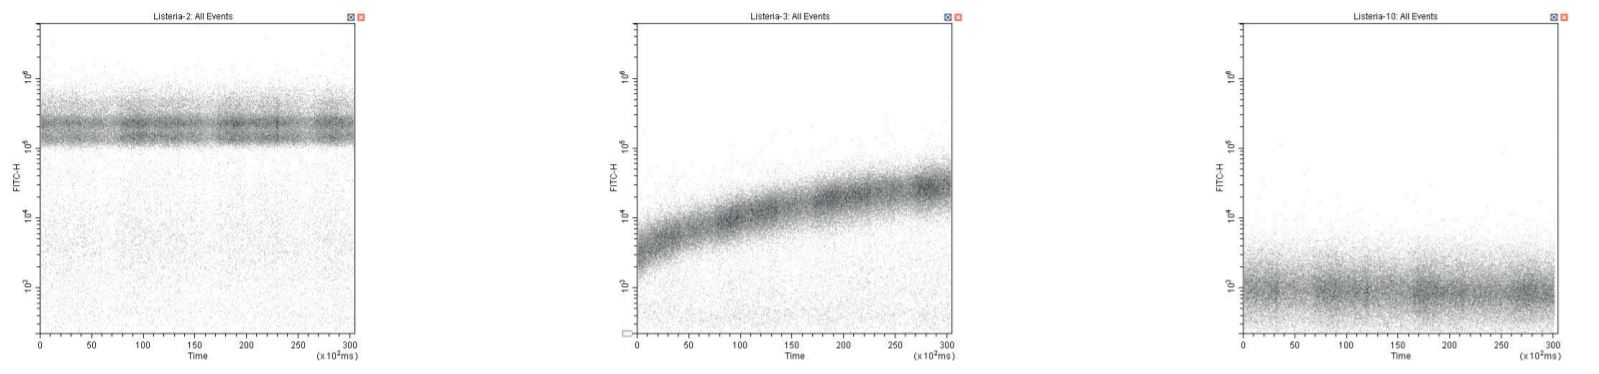
Time-course QC showing SYTO-labelled positive sample (left), negative control showing dramatic time-course labeling due to dye adsorption and release, and correct negative control after cleaning sample-line (right).
The results demonstrated in this application sheet represent those generated on the Beckman Coulter CytoFLEX Flow Cytometer. As differences exist in the performance between analyzers, the author cannot guarantee a similar appearance with the use of other flow Cytometers.
Reagent Details
| Reagent | Supplier | Order Details |
| SYTO BC | Thermo Fisher Scientific | Catalog number: S-34855 |
https://www.thermofisher.com/order/catalog/product/S34855
